Hong Kong Beaten Again By Action Take Profit
At the end of trading on the Stock Exchange of Hong Kong on Wednesday posted a benchmark index closed with a significant decrease. Stock markets had opened with a rose in early trade on Wednesday following the positive sentiment growing in global stock markets and Asia.
Hong Kong shares to be re-surrendered after the Shanghai Stock Exchange closed up slowing down at the end of trading on Wednesday. Drop in Hong Kong stock exchange occurs due to profit taking after yesterday rose by 1 percent.
Leading stocks in Hong Kong experienced a weakening closure. Cheung Kong decreased by 1:20 hkd be 137.40 hkd. Hang Seng Bank recorded impairment of 0:50 hkd be 126.80 hkd. Hutchinson hit down 1.00 hkd be 92.95 hkd.
At the end of trading Wednesday benchmark indices in Hong Kong stock market closed with a significant weakening. Spot index hangs zinc hit sharply by 225.68 points or 0.95 percent and closed paada position 23428.62 points.
Analyst estimates that on Thursday’s trading Stock Exchange of Hong Kong will be the performance of the stock market the United States and Europe. Important data that will seize the attention Wednesday is the ADP Non-Farm Employment Change and ISM Non-Manufacturing PMI from the United States. Of Europe will be announced the final services PMI data and retail sales for the month of November.
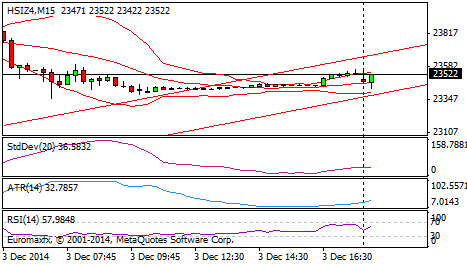
On the next trading index movement hangs zinc in Hong Kong is likely to see volatile movement. A few days later the benchmark Hang Seng index suffered forward-backward movement big enough. The Hang Seng Index has the potential to test the strong resistance level at position 23 550 points, with the next resistance level at 23650. As for the level of support in the event of a reversal in the direction of lower level the next support at 23300 and 23200 points position.
Technically, the index on the trading session today, Thursday (04/11) is likely to strengthen, test positive trend. At the M15 chart bullish hammer formation provides opportunities for the index to move upside. However, the volume of which is likely to increase, as well as an early indication of bullish index. In addition, RSI, the M15 chart, are oversold, signaling upside.
It is estimated, the index test the first resistance level of 23570 and 23630. If it fails at 23 522, then the next index is expected to tend to reexamine the level of support that is 23500 and continued until the possibility of being in the 23450 area.
Euro Drops to 27-Month Low Point Ahead of ECB Meeting
The euro fell to a 27-month lows versus the US Dollar as signs of economic weakness region to speculation that the European Central Bank will ease policy further in a meeting Thursday.
Markit Economics report Wednesday showing the composite PMI fell to 51.1 in November from 52.1 in October, the lowest in the 16-month and indicate the economy will only grow 0.1% in the quarter. Euro zone retail sales data also showed weaker growth than forecast in October.
“Speculation about the ECB’s policy measures have increased,” said Brian Daingerfield, currency strategist at RBS Securities in Stamford, Connecticut. “Divergence of monetary policy is still the main theme, and it puts the Euro-Dollar under pressure ahead of the central bank’s policy meeting.”
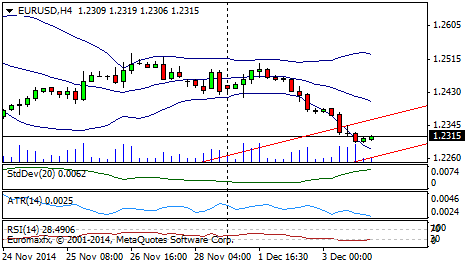
Technically, today’s trading session on Thursday (04/11), the pair Euro-dollar likely to move in a positive trend.
The strengthening of the Euro mainly expected soon reexamine the minimum resistance at 1.2350 and 1.2400 maximum. Meanwhile, if the Euro was unable to break and stays below 1.2315 then another alternative scenario that Euro chance to test support in 1.2300 and 1.2250 area.
Translucent Gold Back to Top $ 1,200
Gold rose on Wednesday, closing above $ 1,200 after the release of US data and keniakan oil prices revive interest in buying gold. ADP reported private company has added 208,000 workers in November, the figure was the lowest in the last three months. Economists had expected the addition of a workforce of 223,000.
While the rise in oil prices eased concern that inflation will continue to lower, reviving demand for gold as a hedge against inflation assets. The correlation between the price of crude oil and gold intensified in recent days, rose to 0.4 on Wednesday, and the highest level since July 2013. Figures closer to 1 indicates the price moves in the same direction.
Previous oil briefly rose after the Energy Information Administration reported crude oil inventories fell 3.7 million barrels in the week ended November 28. Analysts surveyed Platt previous estimate of 380,000 barrels inventories will rise.
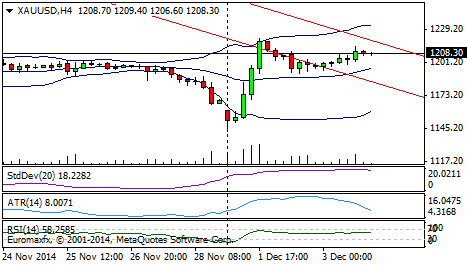
Trade gold on Wednesday closed at $ 1,210.25 per troy ounce with daily highs and lows $ 1,214.88 $ 1,194.44.
Technically, gold in today’s trading session on Thursday (04/11) potentially bearish, tested negative trend back, but prone to reversal. RSI indicator tends to re-test support channel and towards the oversold area, but Bollinger Bands that began to widen, thus giving impetus to the gold to the upside.
It is estimated that the gold price immediately prior to test support in the area of at least 1203.33 and re-test the maximum level of 1198.50. However, if the price of gold is able to break and hold above 1208.30, the estimated price of gold could potentially test the 1210.40 and 1215.00 resistance.