Oil Back Celebrating Hang Seng
The Hang Seng index in Hong Kong shares throughout the trading on Wednesday, appeared successfully closed soared, supported by a surge in energy stocks sharply the impact of soaring world oil prices trading at the end of the Hong Kong stock exchange Wednesday.
CNOOC successfully top performer traded stocks on Wednesday, with closed soared by 13.74%, followed by shares of China Shenhua Energy at 9:25%, shares of PetroChina 9:20%, shares of Kunlun Energy 8:46%, shares of China Petroleum & Chemical amounted to 6.63%, besides it also strengthened by the China Overseas Land for 8:03%, Bank of China 4.64%, China Construction Bank 4:49%, and shares of China Resources Enterprise at 4:21%.
Hang Seng index movement spot on Wednesday successfully closed rose sharply by 684.14 points, or 3:13%, by becoming 22515.76 points from the closing position at the end of the previous stock exchange trading on the position of 21831.62 points and managed to record the highest strengthening trading on Wednesday on position 22527.79 points and the lowest on Wednesday the position of 21817.42 points.
Likewise, the movement of the index futures Hang Seng Wednesday closed soared by 445 points, or 2% to be 22 468 points from the closing position at the end of trading stock exchanges previously at position 22 023 points and managed to record the biggest gain Wednesday at position 22 491 points and Wednesday lows at position 22 045 points.
Continue on the Hong Kong stock market trading Thursday, predicted that investors will get back forward and respond to the results of data releases in the country’s foreign exchange reserves in September which showed an increase to $ 345.8B from the previous releases in the position of $ 334.4B.
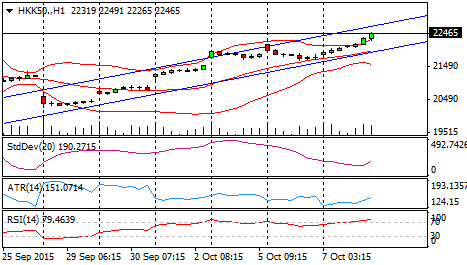
Technically, the index on the trading session today, Thursday (08/10) likely to strengthen, test positive trend. At the M15 chart bullish hammer formation to provide opportunities for the index to move upside. However, the volume tends to increase, as well as an early indication of bullish index. In addition, RSI, the M15 chart, was oversold, signaling upside.
It is estimated, the index test the first resistance level of 22525 and 22600. If it fails at 22 465, then the next index is expected to tend to retest the support level of 22410 and continued up to the possibility of being in the 22350 area.
Yen This Morning Bright
The Japanese yen in Asian trade on Thursday (8/10) morning seemed to strengthen against the US dollar. Driven from the improved trade balance.
USDJPY fell -0.07% to 119.93. Japan’s trade balance released by the Ministry of Finance observed a rise in the level of 1.59T, from the previous month, which only reached the level of 1.32T. While core machinery orders or core machinery orders in August looks down, in a cabinet office report that Japanese core machinery orders fell to -5.7% from -3.6% in the previous month.
While yesterday the Bank of Japan (BoJ) said it still retains its stimulus from the purchase of assets (approximately $ 50 billion / mth), yet another disis, BOJ recognizes that Japan’s economy has slowed due to the weak domestic activity and lower demand for Japanese exports. BOJ so far has managed to expand its monetary stimulus program that was great, but with inflation below 1%, the central bank may have to act in the future if the economy wants to move quickly to reach the target of 2%.
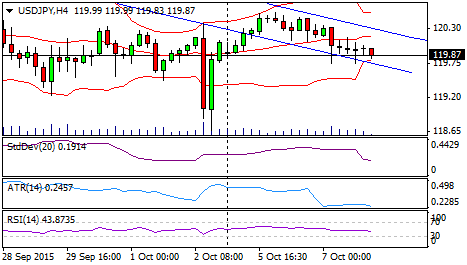
Technically, the trading session today, Thursday (08/10), the dollar yen pair has an opportunity to move in a negative trend.
Weakening Yen mainly expected soon reexamine the minimum support at 119.10 and 118.25 maximum. Meanwhile, if the Yen is able to break and hold above 119.87, then another alternative scenario the Yen chance to test the resistance at 120.25 and 120.75 area.
Gold Slips From 2-week Peak Level
Gold slips from 2-week highs and traded lower on Wednesday as the US dollar rebounded. However, expectations that the US Federal Reserve will delay interest rate hikes until next year still limit the decline of this precious metal. The market was also relatively quiet as traders await the minutes from the Fed meeting in September will be published on Thursday.
Previously, expectations about a Fed rate hike has put gold under pressure. The interest rate that is higher will boost demand for the US dollar, and vice versa dimming the investment appeal of non-yielding assets such as bullion.
But a number of recent US economic data and concerns about the weak global economy have pushed the majority of market participants to reduce expectations of a rate hike in the US this year. Which so far has helped the price of gold rose about 3% this month.
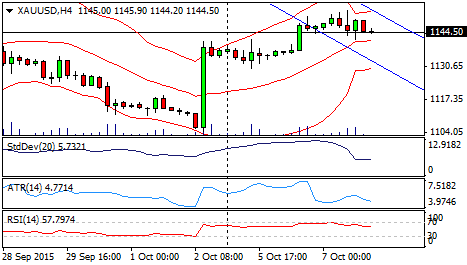
Technically, gold in today’s trading session on Thursday (08/10) potentially bearish, tested negative trend back, but prone to reversal. RSI indicator tends to re-test support channel and towards the oversold area, but Bollinger Band begins to widen, thus giving impetus for gold to the upside.
It is estimated that the gold price immediately prior to test support in the area of at least 1139.20 and re-test the maximum level of 1134.10. However, if the price of gold is able to break and hold above 1144.50, the predicted gold prices could potentially test Resistance ie, 1147.40 and 1152.10.