Nikkei Down In Mid-Session
Nikkei index futures fell in the mid-morning session, marking a potential first-day drop in 14 days, with traders predict no profit taking after enjoying the rally since the middle of last month.
For the fundamental side, the Nikkei gained influence the yen against the US dollar trading. The US dollar held near 11-year highs against the currency pair, with the help suppress the rise in bond yields and manufacturing and consumer spending are disappointing. US employment data on Friday be waiting investors as confirmation of the US economy.
As for the corporate stock looks dominated the movement of the technology sector. The headline Nikkei stocks rose, led by Kyocera Corp. shares rose 2.1% followed by Tokyo Electron Ltd which rose 1.5%. But Sharp which predicts a decline in earnings this year to suppress the Nikkei trading shares fell 9.8%. While the automotive sector adds fluctuation index movement with Toyota Motor Corp. fell 0.6% and Honda Motor Co. rose 0.4%.
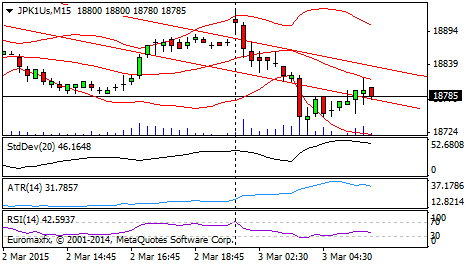
So far Nikkei futures traded in the range of 18 760 daily lows near 18 725 and 18 930 away from daily highs.
Technically, the index on the trading session today, Tuesday (03/03) likely to weaken, test negative trends, the impact of Wall Street. At the M15 chart bearish engulfing formation provides opportunities for the index to move downside. However, the volume tends to rise, early indications bullish index. In addition, RSI, the M15 chart, are oversold, signaling upside.
It is estimated, the index test the first support level that is 18 725 and 18 785 18675. If you fail, then the next index is expected to tend to retest the resistance level of 18830 and continued until the possibilities are in the area of 18 880.
Economic Data Varies, Sterling Weakens
Sterling weakened against the dollar on Monday trading, further away from its highest level in eight weeks after some varies economic data released Monday. While the British general election will be conducted in May began to affect sentiment in the financial markets.
Data released Monday showed house prices in the UK fell for the first time in five months in February of -0.1%, while breaking expectations of a 0.4% increase from January, which rose 0.3%. Data released by the Nationwide also showed house prices rose 5.7% on an annual basis in February, and is the lowest rate of increase since the month of September 2013.
While the Markit / CIPS UK manufacturing activity index reported in February of 54.1 up from 53.1 the previous month and better-than-estimated 53.5 data. However, the index for export levels recorded decreases, so that the reinforcement is more driven by domestic demand. Figures index in February was also the highest level in seven months.
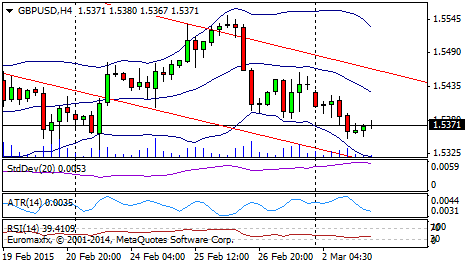
Technically, the trading session today, Tuesday (03/03), pound sterling-dollar pair a chance to move in the negative trend.
The weakening of the pound sterling primarily expected soon reexamine the minimum support at 1.5325 and 1.5250 maximum. Meanwhile, if the pound sterling was able to break and hold above 1.5371, then the other alternative scenario that Pound chance to test resistance in 1.5400 and 1.5460 area.
Ahead of RBA Gold Down, Oil Wait Inventory Data
Gold prices remained steady decline in early Asia as investors continue to monitor China’s monetary policy and import restrictions in India. China cut interest rates for the second time in less than four months.
Some economists estimate there will be easing measures for the rest of this year. In India, the market reacted to the shocking news that the government of Prime Minister Narendra Modi will keep interest rates of state taxes for import of gold, although there is speculation that occurred during the months that the government could cut the import duty. Indian Finance Minister Arun Jaitley maintain gold imports by 10 percent. In 2013, India increased taxes on three separate occasions.
On the Comex division of the New York Mercantile Exchange, gold futures for April delivery fell 0.02% to $ 1,206.40 per troy ounce. Meanwhile, silver for May delivery rose 0.20% to $ 16.418 per troy ounce. Yesterday gold prices slipped after reaching its highest point in two weeks, amid conflicting reports about the demand for precious metals from the two biggest buyers in the world, China and India , two countries that combine more than 50% of all global gold purchases. Gold initially rose in morning trading after the release of a series of Chinese economic data.
While the price of crude oil rose slightly in Asia ahead of US crude oil reserves of data. The American Petroleum Institute will release its estimate of US crude oil, distillate and gasoline stocks last week. US Department of Energy will announce its data.
On the New York Mercantile Exchange, crude oil for April delivery rose 0.18% to trade at $ 49.83 a barrel. Overnight, West Texas Intermediate crude futures dismissed earlier as traders digested weakening US economic data in their efforts to measure the strength of the economy. The Institute for Supply Management said its purchasing managers index fell to a 13-month reading of 52.9 in February from 53.5 in January. It was the first decline in consumer spending since the beginning of 2009. Consumer spending is the largest single source of US economic growth.
Increase in crude oil prices also still appears to be limited as investors continue to focus on North American oversupply. Elsewhere, on the ICE Futures Exchange in London, Brent crude for April delivery fell $ 1.14, or 1.81%, to trade at $ 61.45 a barrel at midday kekhawatiranadanya disruption to supplies from Libya.
Today the focus of traders of commodities, especially gold will also be on the agenda of the RBA, Australia’s central bank, despite the country’s largest gold user is not, as one of the major producers of these metals will be no effect happens when the RBA monetary policy released. Economists counted RBA will cut interest rates. If so true, gold prices could surge.
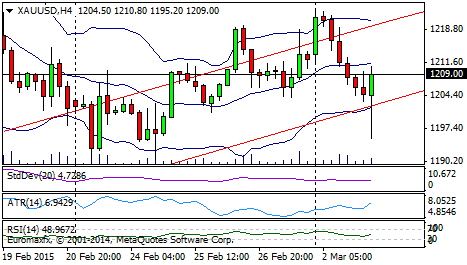
Technically, gold trading session today, Tuesday (03/03) the potential reversal, tested positive trend, but prone to taking profit. RSI indicator tends to re-test resistance and aiming the bullish channel, but Bollinger Bands that began to shrink, thus giving impetus to the gold to the downside.
It is estimated that the gold price immediately prior to test resistance in the area of at least 1214.10 and re-test the maximum level of 1220.87. However, if the price of gold was unable to break and stays below 1209.00 then estimated the price of gold could potentially test the 1227.78 and 1220.40 Support.