


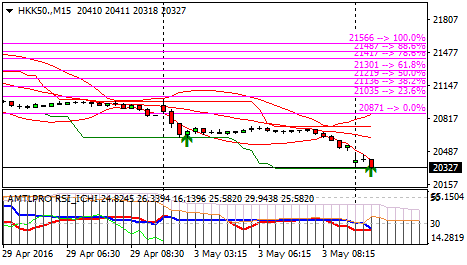
Hang Seng Down
At the close of trading yesterday, the Hang Seng index in Hong Kong Stock Exchange closed down -390.11 points, or -1.85 percent, to 20676.94. The weakening of the Hang Seng index triggered a negative performance of property stocks. The weakening of the Hong Kong exchange yesterday was the decline the most in almost 12 weeks.
Weakening property stocks pressured concerns property bubble in Hong Kong.
In the first quarter of 2016, the number of housing units are still under construction a new record: 13,300, according to the South China Morning Post reported, citing data from the Bureau of Transport and Housing of Hong Kong.
For comparison in 2015, 11,300 new homes completed. This year, the number will jump 61% to 18,200. For three to four years into the future, 92 000 new homes will hit the market.
In trading this morning property stocks plummeted. Shares of Hang Lung Properties Ltd. fell -4.26%, Sun Hung Kai Properties Ltd. fell -2.50%, shares of Cheung Kong Property Holdings Ltd. fell -2.44%.
While the movement of the Hang Seng index futures fell -339 points, or -1.63% at 20,515.00, down from the previous closing at 20,854.00.
Technically,
Resistance: 20590 20670 20 790 Prev. High / Low: 20984/20502
Support: 20500 20450 20 360 Closed Price: 20 544
Comment: For intraday trade today suggest Buy 20450; stop loss at the level of 20400; the target at the level of 20 725.
Asian Stocks Were Mostly Lower
Japan’s Nikkei index tumbled 3.11 percent, adding to Thursday’s 3.61 percent loss (Japanese markets were closed on Friday for a national holiday), after the country’s currency realized its largest two-day gain against the U.S. dollar since 2008.
“While lingering disappointment from the Bank of Japan’s inaction continues to weigh in Japanese markets, negative sentiment started filtering through to other global markets and this ripple effect should be closely monitored as the negative impact from waning global risk sentiment could add more fuel to an already overheated yen,” CNBC quoted Stephen Innes, a senior trader at OANDA as saying in a note Monday.
Hong Kong’s Hang Seng index lost 1.50 percent, Taiwan’s TSEC index lost 1.13 percent, India’s Mumbai Sensex index lost 0.66 percent, China’s Shanghai index lost 0.25 percent and Australia’s ASX index lost 0.08 percent.
Meanwhile, global investors were taking a different approach to European equities. With more than 4 hours of trading remaining, Germany’s DAX index led major European indices wit a 0.85 percent gain. France’s CAC index was higher by 0.39 percent while the broad Euro Stoxx index was higher by 0.22 percent.
UK markets were closed for a national holiday.
Oil prices were trading lower Monday morning. As a reminder, the Organization of the Petroleum Exporting Countries said on Friday its April export activity rose to 32.64 million barrels per day (from 32.47 million in March) – close to the highest level in recent history.
Crude futures for June delivery were lower by 0.7 percent at $45.60 a barrel, while Brent crude for June delivery was lower by 1.1 percent at $46.84 a barrel.
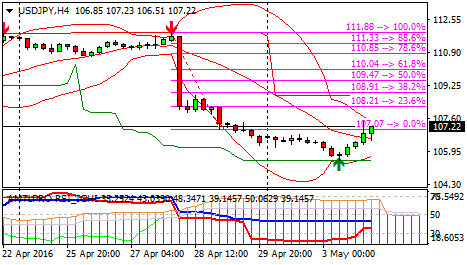
Dollars Moving Flat Against Yen
The US dollar was flat against the yen was observed when the middle market attention focused on US ADP report nonfarm payrolls.
Ongoing trade in the Asian session, the USDJPY observed flat at 106.63 level where the couple moves touching a low of 106.53 and a high level at 107.45. In US dollar index, which shows the performance of the greenback against a basket of six other major currencies tracked down the level of 0.05% at 92.97.
Demand greenback in recent time still overshadowed pressure on weakened against some other major currencies, after the Fed’s decision to take steps to keep keep interest rates unchanged. In another session, the slowdown of inflation for the Americas region itself is still very low.
Meanwhile, the lack of fundamental reports this morning the global economy is likely to bring a calmer market movements and to the Bank of Japan itself was still closed in commemorating a national holiday.
Technically,
Resistance: 107.00 107.40 107.80 High / Low: 106.85 / 106.51
Support: 105.20 105.80 106.20 Running Price: 106.60
Comment: For intraday trade today suggest Buy 106.00; stop loss at the level of 105.75; target at the level of 107.40.
Watch For EUR/USD Pullback
The 60-minute EUR/USD Forex chart has a parabolic wedge top at a measured move projection. The minimum target is the bottom of the final leg up, and then a trading range is likely.
The EUR/USD is overbought after a 7-day bull micro channel where all of the candlesticks were bull trend bars. The odds are that there will be a pullback soon.
The 60-minute chart reversed down from a bull breakout above a bull channel. The reversal down has lasted 5 hours and it has several strong bear trend bars. A reasonable 1st target is the bottom of the final buy climax at around 1.1520. Since the selloff is already big enough to qualify as a Big Down after a Big Up, the odds are that a trading range has begun.
Online daytraders will look to sell the 1st rally on the 60-minute chart, expecting at least one more leg down. There are bulls who bought near the top, but did not yet exit. They want a bounce that will allow them to sell with a smaller loss. There are also bears who missed the sell and want a rally that will allow them to sell higher. With bulls trapped in and bears trapped out, the odds are that the 1st rally will be sold.
It is too early to know if the trading range of the next few days will be shallow, with a bottom around the May 2 low of 1.1520, or if it will be deep. It might test all of the way down to the gap between the April 29 high and below the May 2 low. The reversal down overnight came at a measured move projection up from that gap, so Forex traders obviously are paying attention to it.
The overnight selling on the 5-minute chart lasted more than 50 bars in a tight channel. That is unsustainable and therefore climactic. This means that the EUR/USD Forex chart might enter a trading range for several hours. However, the odds still favor a 2nd leg down after any pause, and a minimum target for the bears of 1.1520.
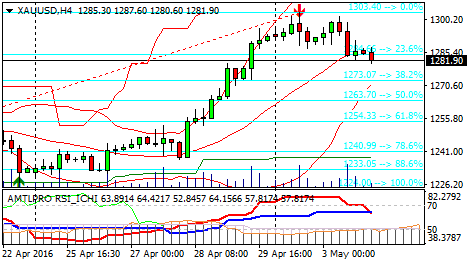
Gold Prices Back Corrected
Gold prices turned lower yesterday, after briefly approaching the peak levels reached 15 months in the previous session, as the dollar is moving higher and Federal Reserve officials sinyalkan there are two possible interest rate hikes in 2016.
Spot gold prices fell 0:39%, at $ 1,286.01 / onz, away from a session high at 1,301.75. The price of gold on Monday touched its strongest level since January 2015 at $ 1,303.60.
The pressure on gold prices came from US dollar moved higher against a basket of major currencies for the first time in seven sessions in a dramatic change from the lowest level in more than 15 months.
Senior market analyst at RJO Futures in Chicago, said that any strengthening of the dollar should be given to the gold price correction.
In the US session, Atlanta Fed President Dennis Lockhart told reporters that the two interest rate hikes are still possible in (2016). We still have a number of meetings (Fed policy), but it all still depends on how the economy develops.
Technically,
Resistance: 1288.10 1291.60 1293.40 High / Low: 1286.80 / 1284.30
Support: 1283.70 1281.00 1279.10 Running Price: 1285.80
Comment: For intraday trade today suggest Buy 1282.50; stop loss at the level of 1280.00; target at the level of 1292.50.
Gold Reaching Higher
Gold rose on Tuesday, in another attempt to cross the key $1,300-an-ounce level, as the U.S. dollar extended losses and as assets of the top bullion fund rose to their highest in over two years.
Gold has rallied sharply since late last week after the dollar slumped on the Federal Reserve’s cautious stance towards higher U.S. rates and as the yen soared after the Bank of Japan stood pat on policy last week.
The metal rose to $1,303.60 an ounce on Monday, its strongest since January 2015, but ended the day lower on profit-taking.
Spot gold had climbed 0.2 percent to $1,293.30 an ounce by 0633 GMT, after earlier hitting a session high of $1,296.81. “I think gold can reach $1,300-$1,400 in the second quarter.
Investors are following the yen-dollar movement and central bank decisions, and the ETF inflows are a very good sign,” said Mark To, head of research at Wing Fung Financial Group.
Gold edged lower on Wednesday in Asia as investors look ahead to U.S. jobs data at the end of the week for direction on the path of U.S. interest rates.
On the Comex division of the New York Mercantile Exchange, gold for June fell 0.27% to $1,288.30 a troy ounce.
Silver futures for May delivery dropped 1,.11% to $17.640 a troy ounce, while copper futures edged up 0.05% to $2.218 a pound.
Overnight, gold fell slightly on Tuesday, despite signs that a widespread global economic slowdown could resurface, as the dollar bounced off 15-month lows and a non-voting member of the Federal Reserve failed to rule out the possibility for as many as two interest rate hikes by the U.S. central bank before the end of the year.
A session earlier, gold cleared the $1,300 level for the first time since last January, as soft U.S. manufacturing data pushed the dollar to its lowest levels since last summer. Over the first four months of the year, the previous metal has surged more than 21% and is on pace for one of its strongest first halves in more than a decade.
On Tuesday morning, Federal Reserve Bank of Atlanta president Dennis Lockhart told reporters at the 21st Annual Financial Markets Conference outside of Jacksonville, Florida, that although it is still possible for the Fed to raise short-term interest rates this year, further tightening “depends entirely on how the economy evolves.”
Last week, the Federal Open Market Committee (FOMC) held its benchmark Fed Funds Rate at its current targeted range between 0.25 and 0.50%, citing an uncertain economic and inflationary outlook. Lockhart is a non-voting of the FOMC during the current cycle.
Any rate hikes by the Fed this year are viewed as bearish for gold, which struggles to compete with high-yield bearing assets in rising rate environments.
When the Fed ended a six-year Quantitative Easing program in October, 2014, Core PCE inflation stood at 1.6%, slightly below its targeted 2% objective.
When the U.S. Commerce Department released its Core PCE price index last week for April, the reading was virtually unchanged from its level 21 months earlier. At a separate panel during Tuesday’s conference, Fed Cleveland president Loretta Mester, a voting member, emphasized that there’s “convincing evidence,” that Quantitative Easing is not infinite. Core PCE inflation, the Fed’s preferred gauge of price stability, strips out volatile food and energy prices.
Currently, the European Central Bank and the Bank of Japan, two of the world’s largest central banks, are operating large-scale asset purchasing programs in an effort to stave off deflation. While BOJ president Haruhiko Kuroda indicated that the BOJ could employ additional easing measures in March, the Japanese central bank surprised investors last week by leaving its benchmark interest rate unchanged. Also in March, the ECB increased the frequency and duration of its €1.5 trillion bond buying program, as inflation remains near historically-low levels.

