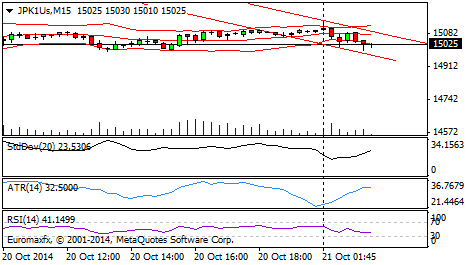
Profit-Taking Paint Nikkei
Nikkei recorded thin weakening in early Asia as the emergence of profit-taking after recent strong rally. The Nikkei rallied strong in the last three sessions after improvement in US economic data at the end of last week, and the central bank’s liquidity injection China successfully restore investor optimism over the global economic outlook. The emergence of reports that the Japanese government pension funds will increase the share of investment in local shares also gave a positive sentiment.
Technically, the index in the trading session today, Tuesday (21/10) likely to weaken, test negative trends, the impact of Wall Street. On the bearish engulfing formation M15 chart gives an opportunity for the index to move downside. However, the volume is likely to increase, an early indication of a bullish index. In addition, RSI, on the M15 chart, is in the oversold area, cue upside.
It is estimated, the index test the level of support in advance ie 15000 and 15025 14950. If you fail, then the next index is expected to tend to retest the resistance level of 15 050 and is likely to be continued until the 15080 area.
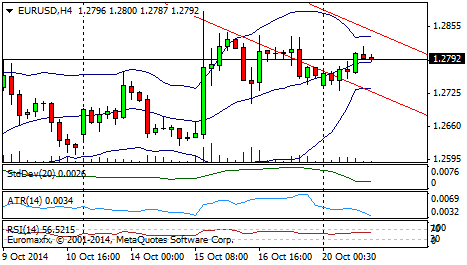
Euro Gains Slightly Against Rival
In foreign exchange trading Monday, the euro was observed to slightly higher against the US dollar and yen amid concern global economic growth and a sell-off in the week
Technically, the trading session today, Tuesday (21/10), the pair euro dollar likely to move in a negative trend.
The weakening of the euro is mainly expected to immediately reexamine the minimum support at 1.2750 and 1.2700 maximum. Meanwhile, if the euro is able to break and hold above 1.2792, then another alternative scenario ie the Euro likely to test resistance in 1.2830 and 1.2880 area.
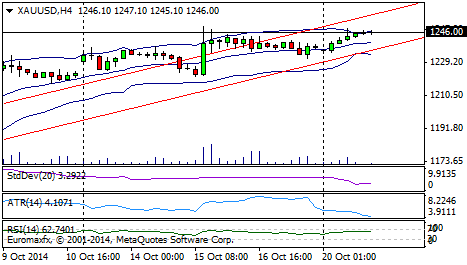
Commodities Precious Metals Back Ends Higher
Trading commodity exchanges in the precious metals Monday ended higher when combined on global economic uncertainty has increased the demand for gold and silver.
Technically, gold trading session today, Tuesday (21/10) the potential reversal, testing positive trend, but prone to taking profit. The RSI indicator is likely to re-test resistance bullish channel and into the area, but the Bollinger Bands which began to shrink, thus giving impetus to gold to the downside.
It is estimated that the price of gold immediately prior to test resistance at least in the area of 1250.50 and re-test the maximum level of 1255.87. However, if the price of gold could not break and stays below 1246.00 then estimated the price of gold has the potential to test the 1243.60 and 1240.10 Support.