Kospi Optimistic With The World Economy
Kospi rose after a series of US economic data on Friday and the release of a report on China’s credit investors remain optimistic about the outlook for the world economy. Increased housing construction permits, the number of homes being built, and US consumer sentiment restore optimism over the sustainability of the economic recovery of Uncle Sam.
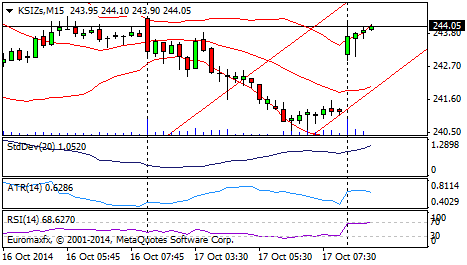
Technically, the index in the trading session today, Monday (20/10) is likely to strengthen, test positive trend. In a bullish hammer formation M15 chart gives an opportunity for the index to move upside. However, the volume is likely to increase, as well as an early indication of a bullish index. In addition, RSI, on the M15 chart, is in the oversold area, cue upside.
It is estimated, the index test the first resistance level of 246.00 and 24.10. If it fails at 244.05, then the next index is expected to tend to retest the support level of 243.50, followed by the possibility of being in the 241.00 area.
Japanese Yen doldrums; Institutions Pension Fund Japan Eyes More Risky Assets
In trading debut this week the Japanese yen’s exchange rate plummeted sharply against the US dollar (20/10). Yen continued its decline for three consecutive sessions and reached the highest level in the past five days against its main rival the US dollar.
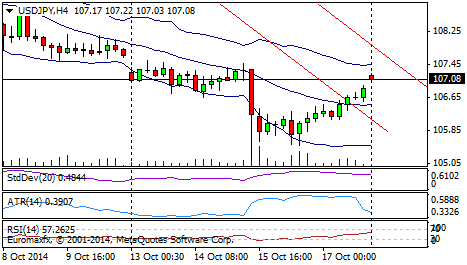
Technically, the trading session today, Monday (20/10), the dollar yen pair likely to move in a negative trend.
A weaker yen is mainly expected to immediately reexamine the minimum support at 105.50 and 103.90 maximum. Meanwhile, if the Yen was able to break and hold above 107.08, then another alternative scenario that is likely to test resistance Yen in 108.50 and 110.00 area.
Precious Metals End Down, But Still Records Weekly Increase
Commodity exchanges trading precious metals on Friday had closed lower, but still recorded a weekly gain when the concerns over global growth market participants.
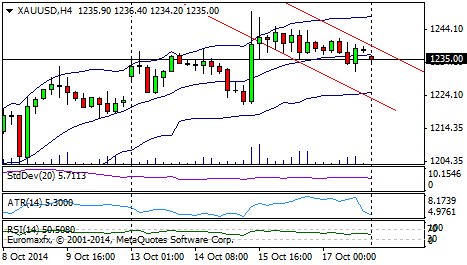
Technically, gold at today’s trading session on Monday (20/10) potentially bearish, tested negative trend back, but prone to reversal. The RSI indicator is likely to re-test support channel and towards the oversold area, but the Bollinger Bands which began to widen, thus giving impetus to gold to the upside.
It is estimated that the price of gold immediately prior to test support at least in the area of 1230.33 and re-test the maximum level of 1225.73. However, if the price of gold is able to break and hold above 1235.00 then estimated the price of gold has the potential to test the 1238.50 and 1243.00 Resistance.