Hang Seng Sustain Performance
Hang Seng recorded a thin reinforcement, helped by a rally in shares of energy producers and other related industries. Investors seem to back glanced energy sector shares and other related industries after world oil prices rebounded sharply towards the close of the New York morning session.
Shares of the energy sector and other related industries in recent depressed enough as world oil prices hit a record 5-year lows this week. Cnooc and Kunlun Energy stocks monitored rose respectively by 1.4% and 1.1%. Hang Seng futures rose 0.33% and is now trading at 24210.
However, investors appear reluctant to push up the index is too high as geopolitical risk spread between China and Taiwan. China announces 4 new commercial flight route along the southeast coast of China.
However, some of these are set unilaterally violated the airspace of Taiwan. This provoked a negative response from Taipei who threatened to expel any air that entered its airspace. China considers Taiwan part of its territory; but Taiwan has gained recognition as an independent state.
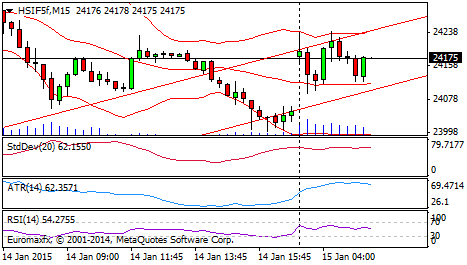
Technically, the index on the trading session today, Thursday (15/01) is likely to strengthen, test positive trend. At the M15 chart bullish hammer formation provides opportunities for the index to move upside. However, the volume of which is likely to increase, as well as an early indication of bullish index. In addition, RSI, the M15 chart, are oversold, signaling upside.
It is estimated, the index test the first resistance level of 24225 and 24300. If it fails in 24175, we then estimated the index tends to retest the support level of 24150 and continued until the possibility of being in the 24100 area.
Yen Weakens As Japan’s Economic Growth Slows
Trading foreign exchange on Thursday (15/1), observed to weaken the yen against the US dollar after the release of a series of Japanese economic data this morning.
Ongoing trade in the Asian session, the USDJPY rose 0:28% to 117.66 where the pair is observed to move hit a daily low of 117.14 for the session and the highest level of 117.70 for the session daily.
The yen weakened against the dollar seen as a slowdown in economic recovery in Japan. Based on the official report released by the Cabinet Office have shown that Japan’s core manufacturing goods orders, which outside orders for ships and utilities have experienced a decline of 1.3% in November.
Meanwhile, at the same time another separate report released by the Bank of Japan has stated that the producer price inflation in Japan region on an annual basis, has experienced a decline of 1.9% in December.
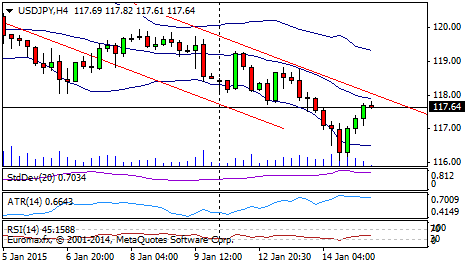
Technically, the trading session today, Thursday (15/01), the dollar yen pair a chance to move in the negative trend.
The weakening of the yen mainly expected soon reexamine the minimum support at 116.10 and 114.25 maximum. Meanwhile, if the Yen was able to break and hold above 117.64, then the other alternative scenario that Yen chance to test resistance in 118.25 and 119.30 area.
Gold and Silver Prices Back Depressed in Morning Session
Trading commodity exchanges in the precious metals Thursday (15/1), the price of gold and silver was observed to naturally decline with trading lower, after a strong rally experienced in the previous session due to a decline in retail sales in the US.
Ongoing trade in the Asian session, gold futures for February delivery was trading lower 0:47% at $ 1.228.70 per troy ounce on the Comex division of the New York Mercantile Exchange. Today’s gold price movements observed touching a $ 1.227.30 to session lows at $ 1.232.40 daily and daily highs for the session.
Meanwhile, silver futures for March delivery traded lower, with the observed decreased by 1:27% at the level of $ 16,773 per troy ounce by the observed moving touched a session low $ 16,765 to $ 16,908 level daily and daily highs for the session.
The decline in metal prices this morning actually still be in a safe area, as a weak US employment growth in the last week have managed to push the price of gold to record solid gains.
However, the rise in gold prices is not only supported by a weaker US job growth but also driven by the decline in US retail sales in December.
Based on the official report released by the Census Bureau have presented to the market that retail sales in the US decreased by 0.9% in December, where the results are unexpected market.
The worsening of the US retail sales results, immediately have pressed for a natural weakening US dollar strong against the major currencies of the world and it provides opportunities for metal prices have strengthened, given the movement of both gold and silver prices tend to be opposite to the greenback.
However, when the release of an official report by the Federal Reserve’s beige book on early this morning has pushed the price of gold for the natural attenuation, but rather support the US dollar rebounded.
In a report of the entire Federal Reserve in the US, has shown that the expansion of economic activities still continue in the period mid-November until the end of December 2014, where most areas have cruised “modest” to “moderate” on growth.
Economic growth has been supported by rising consumer spending in almost all regions of the US, manufacturing activity expanded and housing market conditions naturally rise slowly.
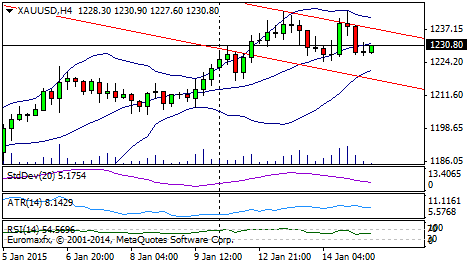
Technically, gold in today’s trading session on Thursday (15/01) potentially bearish, tested negative trend back, but prone to reversal. RSI indicator tends to re-test support channel and towards the oversold area, but Bollinger Bands that began to widen, thus giving impetus to the gold to the upside.
It is estimated that the gold price immediately prior to test support in the area of at least 1228.10 and re-test the maximum level of 1226.50. However, if the price of gold is able to break and hold above 1230.80, the estimated price of gold could potentially test the 1231.60 and 1233.50 resistance.